
Monitor ClickHouse queries in real time
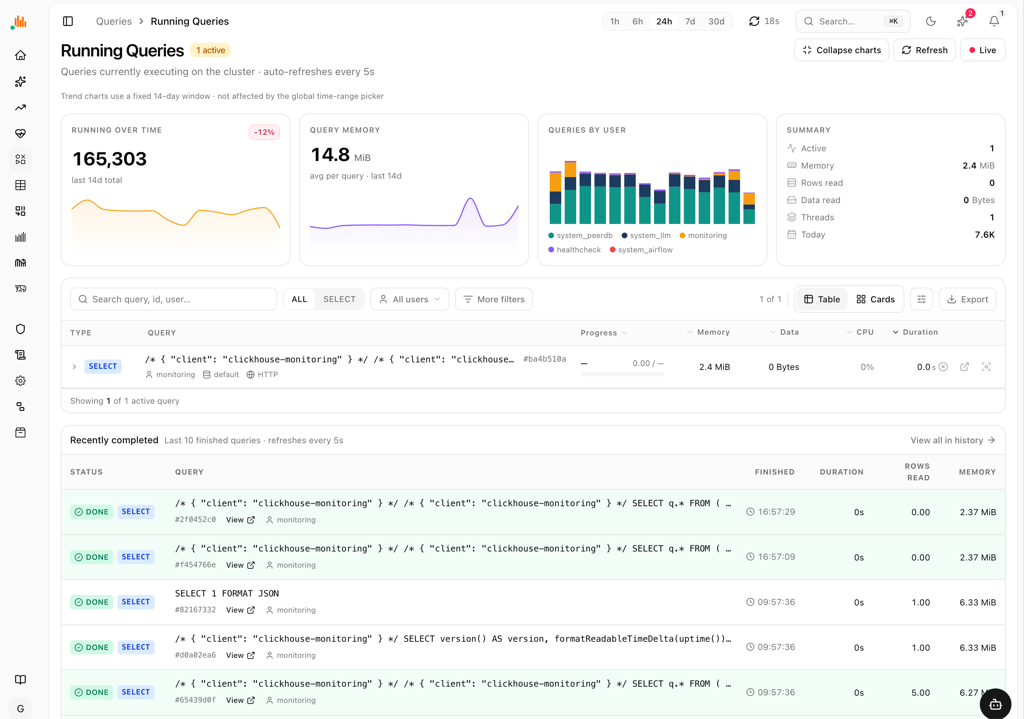
See every running, slow, failed and expensive query as it happens, with duration, memory and rows read, then act: kill a runaway query or review a recommend-only EXPLAIN suggestion for the one that's actually slow.
Built for this, not bolted on
Every query, live
Running, history, failed, slowest and most expensive queries, each with duration, memory, rows read and the full statement. Filter by user and slice by time.
Kill it from the table
Stop a long-running or runaway query directly from the row — no separate SQL client or hand-written KILL QUERY needed.
Recommend-only EXPLAIN suggestions
Run EXPLAIN and get heuristic suggestions — missing PREWHERE, unpruned partitions, unkeyed joins, missing index hints. chmonitor never rewrites or applies anything; you review and apply the fix.
Community
Open source, built in public
Related
More ways to monitor ClickHouse
ClickHouse monitoring
The ops checklist: system.* dashboards for queries, storage, and replication, plus a recommend-only advisor.
Cluster health
A color-coded health board with Slack/Discord alerts and recovery notifications.
Replication
Replica lag, read-only replicas and replication queues, on a live topology map.
Performance
Slowest/most-expensive queries plus a recommend-only tuning and capacity advisor.
ClickHouse dashboard
Pre-built ops pages for queries, health, storage and replication — versus building Grafana panels yourself.
Start monitoring — advisor and alerts built in
Open the hosted dashboard and connect a cluster, or self-host with Docker, Kubernetes, or from source. Self-hosting is always free.