
ClickHouse cluster health monitoring, at a glance
One board of color-coded health checks — replication lag, failed queries, disk, memory, stuck mutations — with alerts to Slack or Discord when something turns red, and again when it recovers.
Built for this, not bolted on
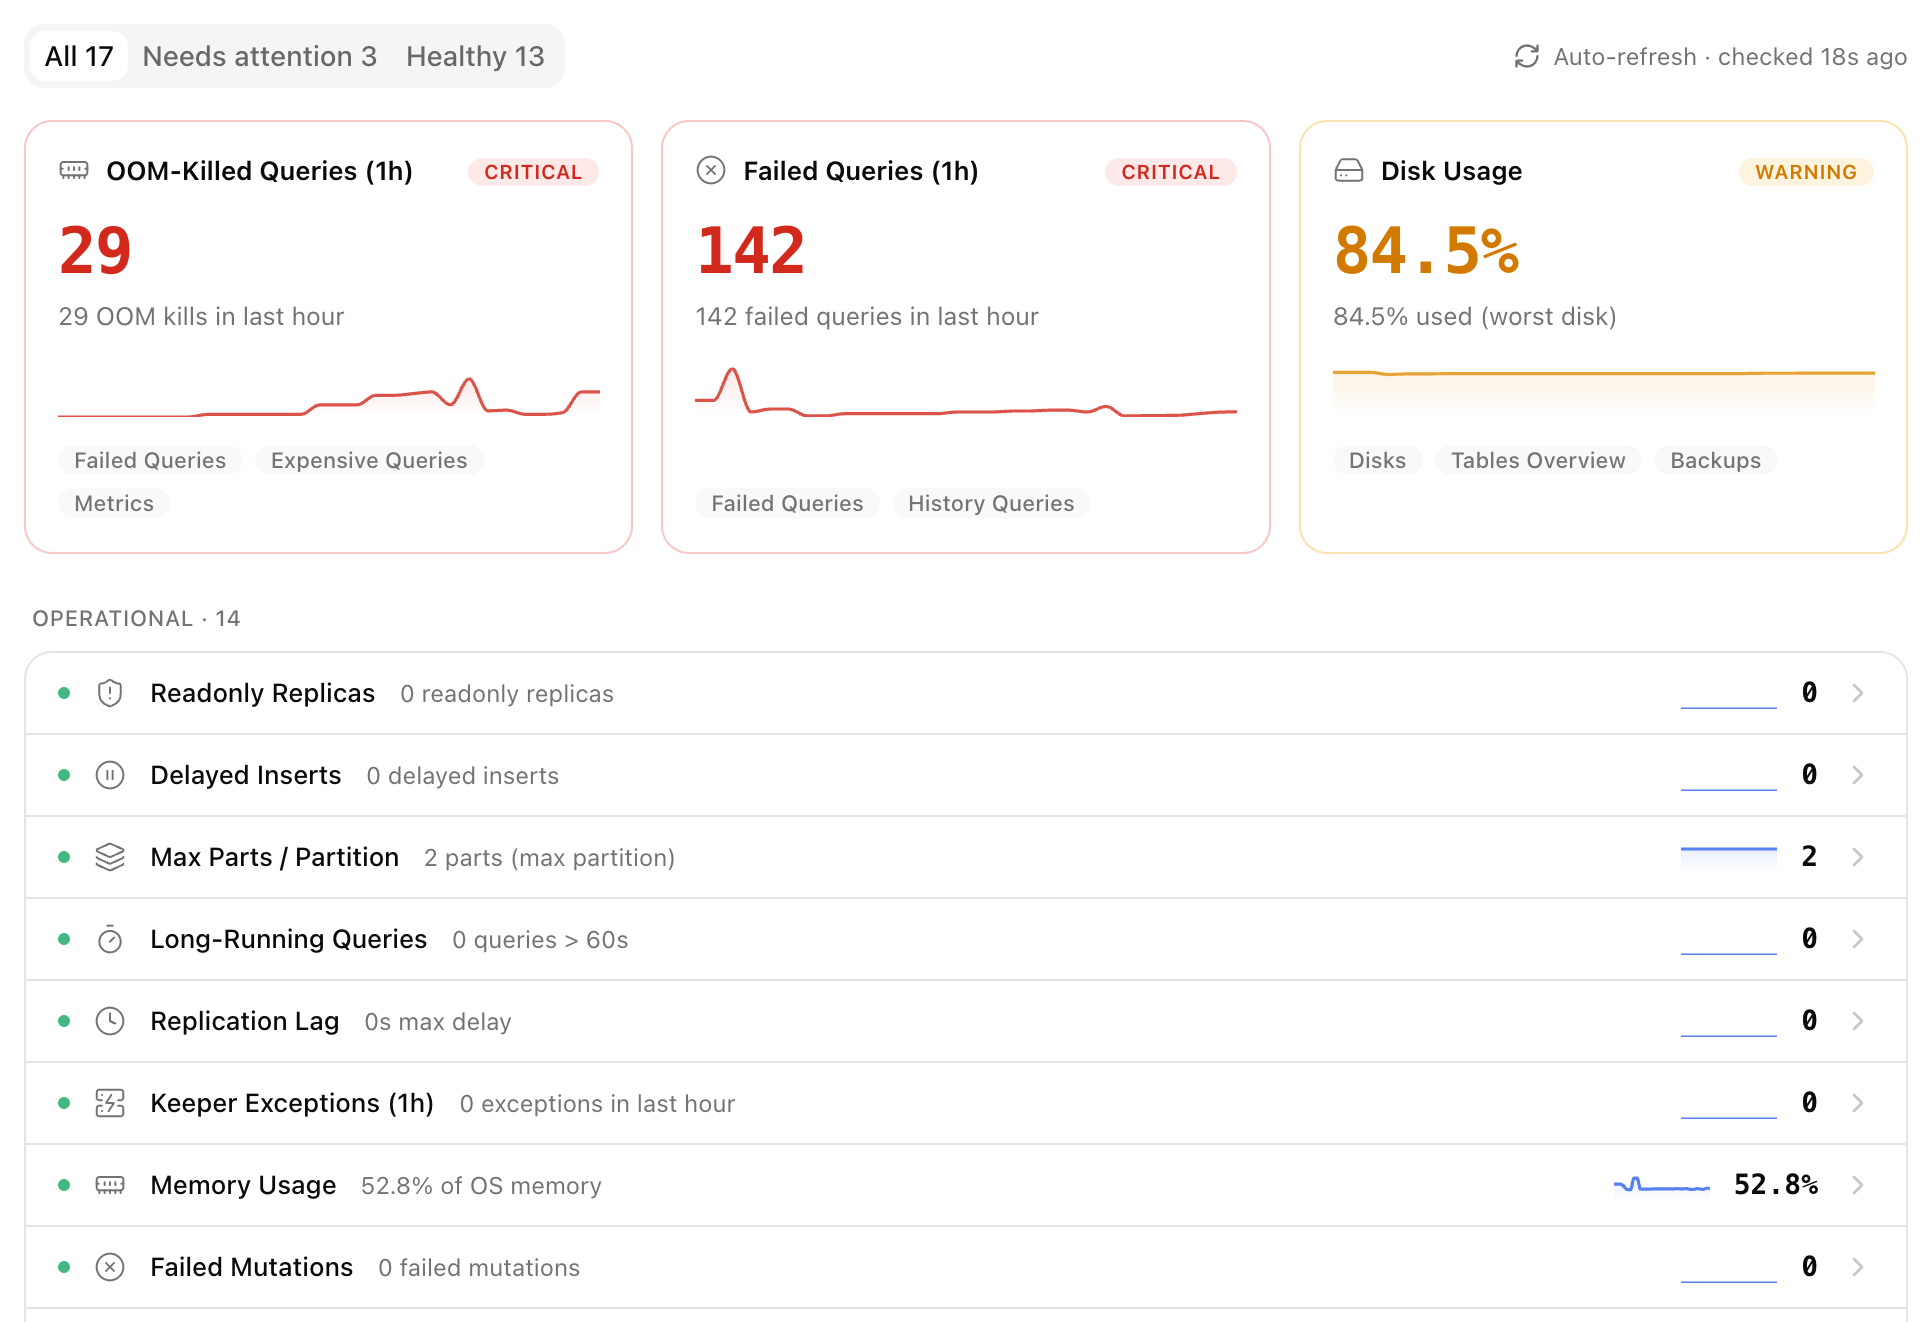
Every health signal in one board
Green, warn or critical indicators for replication lag, readonly replicas, delayed inserts, failed queries, memory, disk, parts-per-partition and stuck mutations.
Alerts to Slack or Discord
Configure one webhook URL and chmonitor posts a message when a check crosses your threshold — and again when it recovers, so you know an incident actually cleared.
A ready audit prompt for your agent
Turn any failing check into a structured prompt — the metric, raw data, relevant system tables and common causes — to paste into an AI agent for a tailored diagnosis.
Community
Open source, built in public
Related
More ways to monitor ClickHouse
ClickHouse monitoring
The ops checklist: system.* dashboards for queries, storage, and replication, plus a recommend-only advisor.
Query monitoring
Running, slow, failed and expensive queries — with kill and recommend-only EXPLAIN suggestions.
Replication
Replica lag, read-only replicas and replication queues, on a live topology map.
Performance
Slowest/most-expensive queries plus a recommend-only tuning and capacity advisor.
ClickHouse dashboard
Pre-built ops pages for queries, health, storage and replication — versus building Grafana panels yourself.
Start monitoring — advisor and alerts built in
Open the hosted dashboard and connect a cluster, or self-host with Docker, Kubernetes, or from source. Self-hosting is always free.