
A ClickHouse dashboard you do not have to assemble
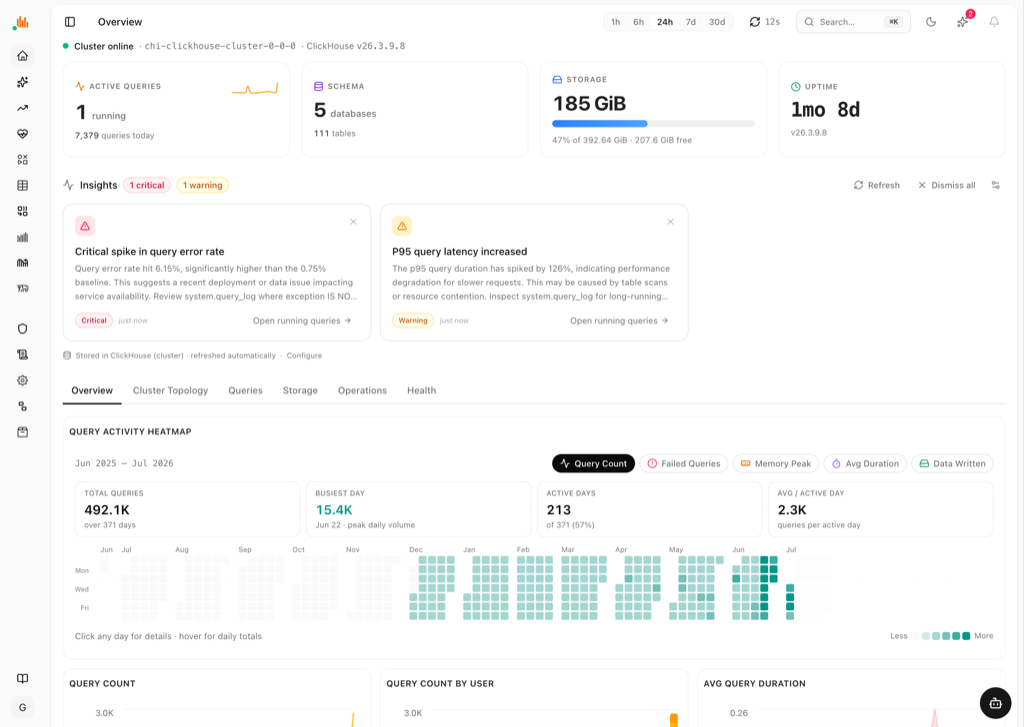
chmonitor is a ClickHouse ops dashboard: complete pages that read system tables, not a blank canvas. Home stays the product brand; this page is what “ClickHouse dashboard” means in practice, and why operators pick chmonitor over wiring panels.
Built for this, not bolted on
Pages, not a panel project
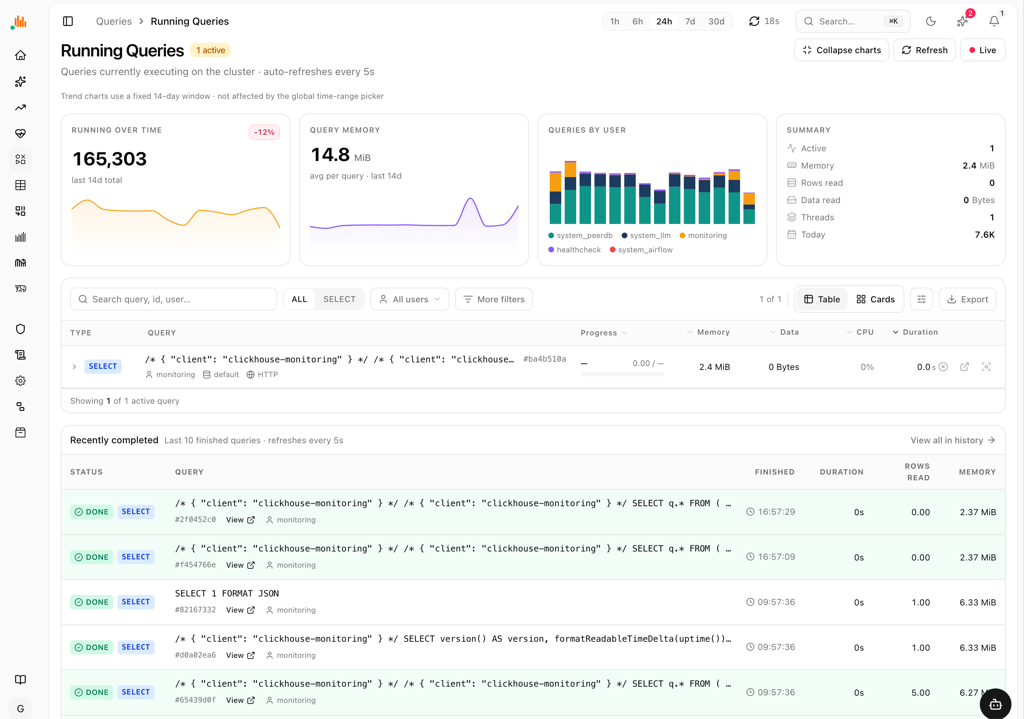
Overview, running queries, health, storage, topology and explorer ship as routes. Grafana plus a ClickHouse plugin is a SQL editor and a blank dashboard — you still write the panels. See the row-by-row matrix on chmonitor vs Grafana.
Ops surfaces operators actually open
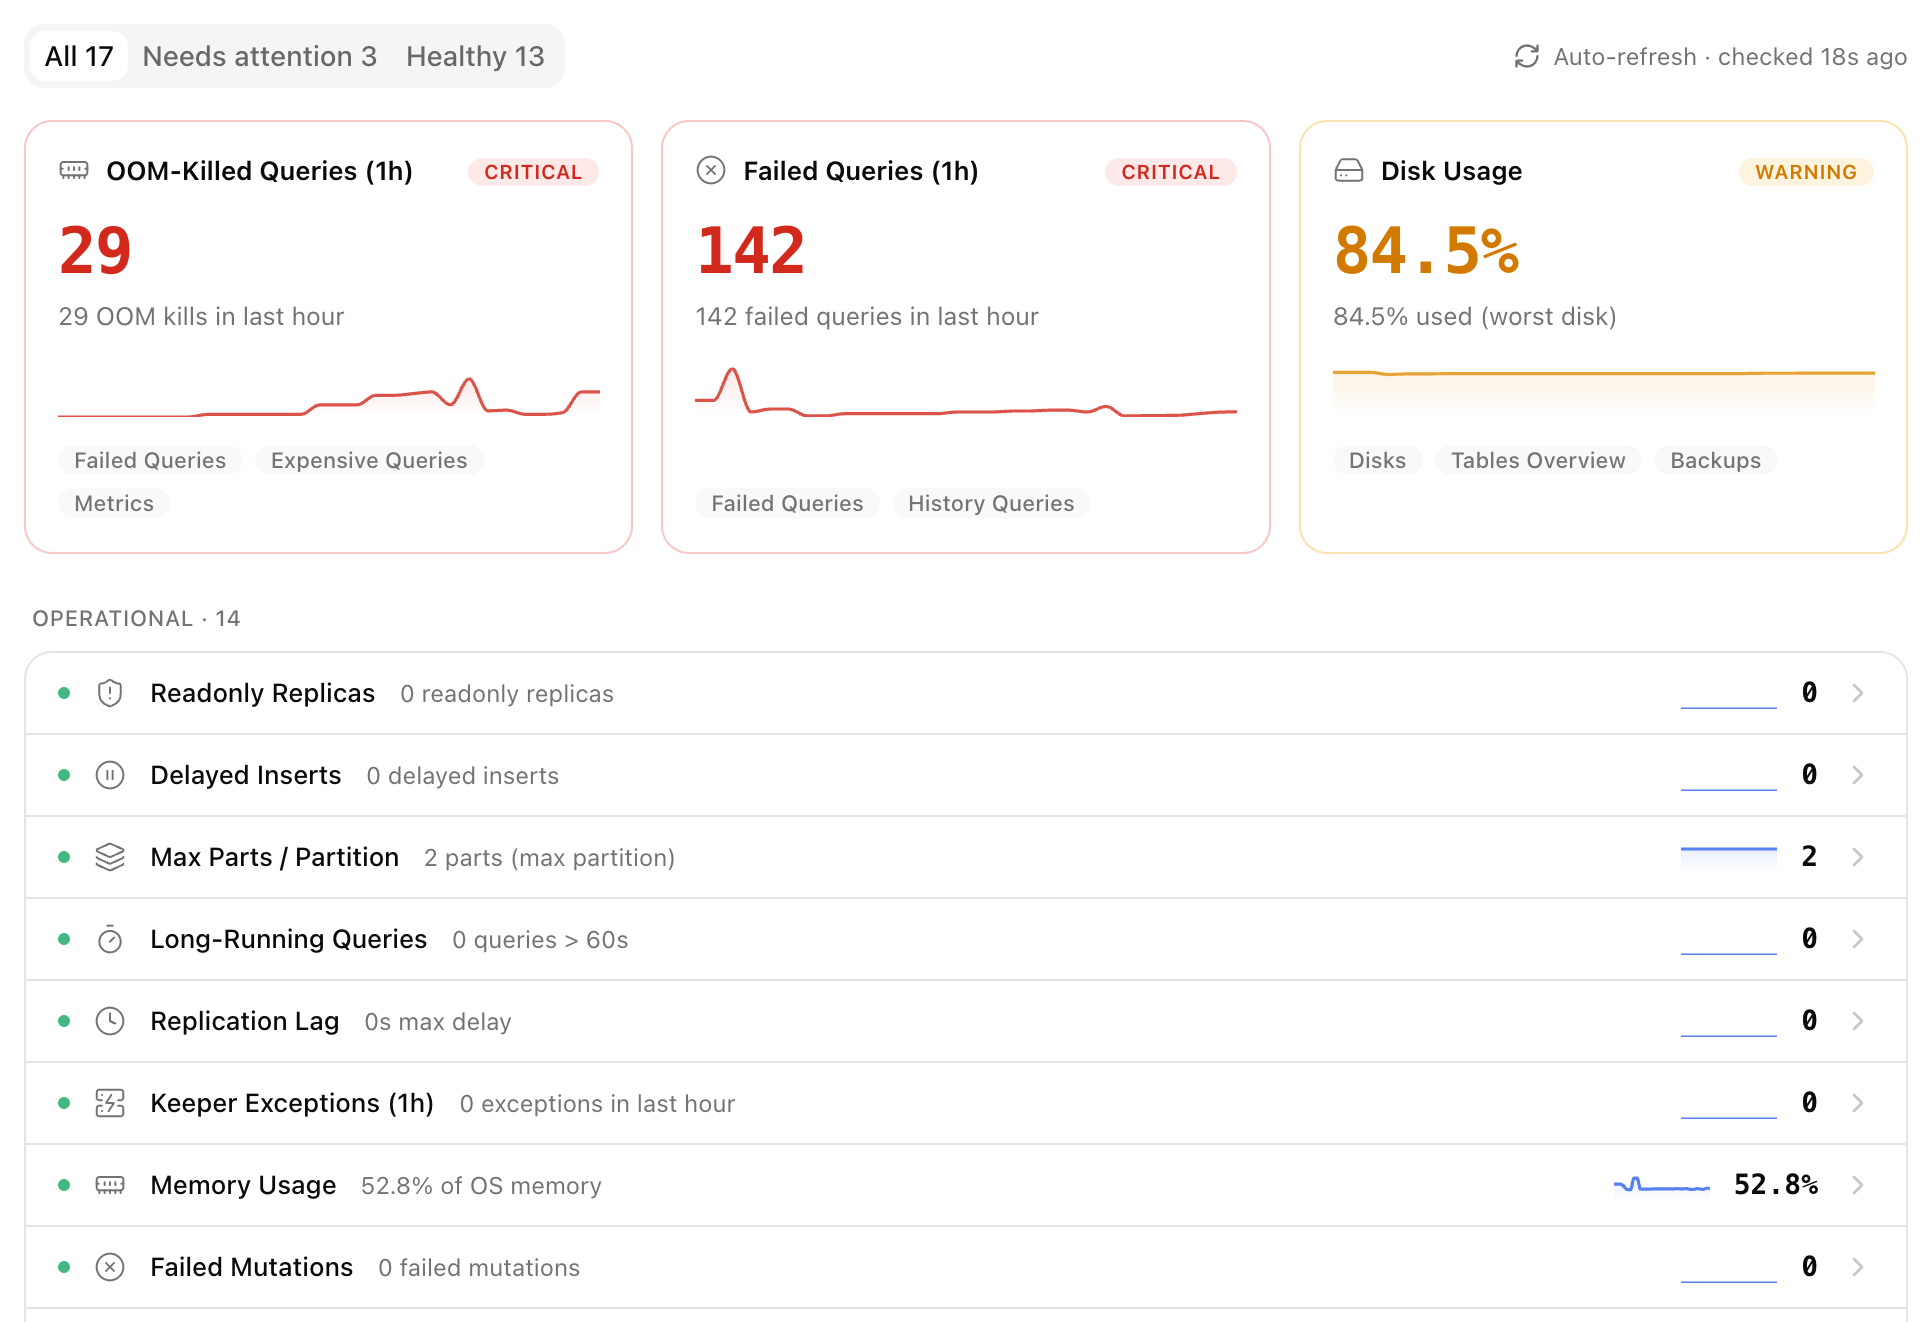
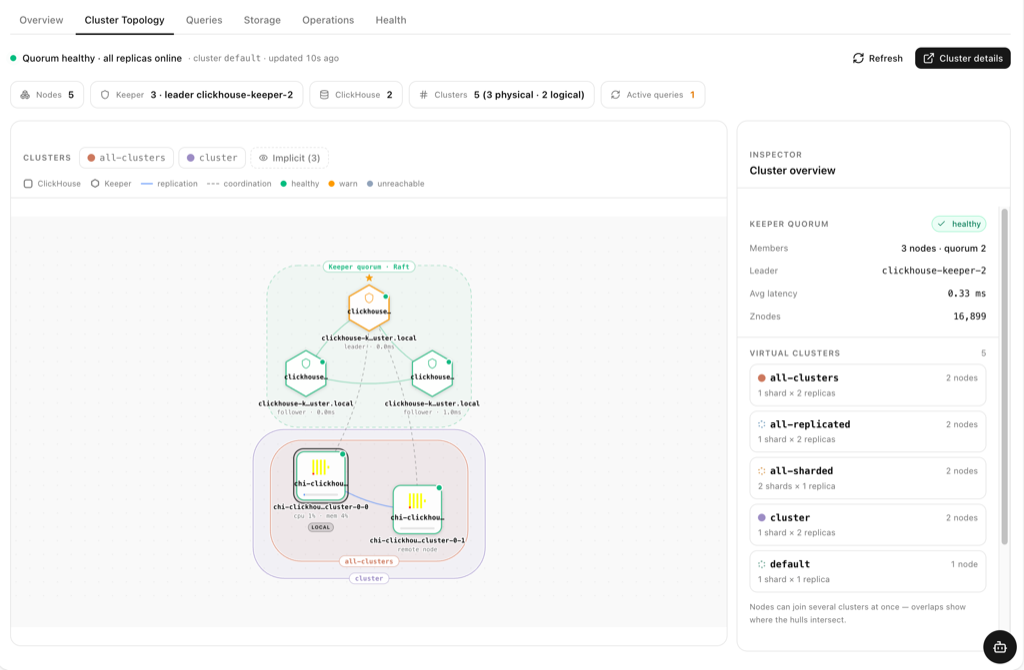
Live queries with kill, color-coded health, replica lag on a topology map, parts and merges, a schema-aware agent. Each screenshot on this page is a real view, not a mock.
Advisor included, recommend-only
EXPLAIN hints and an AI agent that reads schema and query_log. chmonitor never applies DDL. Install with Docker or open the hosted dashboard; docs cover Workers and Helm.
Real dashboard pages, not mockups
Each image is a shipped view. Click through related features for the full walkthrough.
Stop building a ClickHouse Grafana board
Operators searching for a ClickHouse dashboard usually mean “show me queries, lag, disk and merges today,” not “give me a charting canvas.” Grafana plus a ClickHouse plugin wins if you want custom business charts. chmonitor wins if you want ops pages that already exist.
chmonitor
Connect a host. Overview, queries, health, topology, explorer and the agent are routes. SQL is version-aware against system tables.
Grafana + ClickHouse plugin
Install Grafana, add a datasource, write panels, keep them current. Flexible, and a standing dashboard project. Full matrix: chmonitor vs Grafana.
Full-stack APM
Datadog (and similar) cover traces and on-call across your stack. They are not a ClickHouse ops dashboard. See chmonitor vs Datadog.
Also: ClickHouse monitoring· Overview feature· Queries· Query monitoring· Product home
Questions & answers
What is a ClickHouse dashboard?
How is a ClickHouse dashboard different from Grafana?
Is this the same as ClickHouse monitoring?
Does it replace the built-in ClickHouse /dashboard?
How do I install the dashboard?
docker run -d -p 3000:3000 -e CLICKHOUSE_HOST=… ghcr.io/chmonitor/chmonitor:latest. Docs cover Cloudflare Workers and Helm. Or open the hosted dashboard at dash.chmonitor.dev and connect a cluster.Related
More ways to monitor ClickHouse
ClickHouse monitoring
The ops checklist: system.* dashboards for queries, storage, and replication, plus a recommend-only advisor.
Query monitoring
Running, slow, failed and expensive queries — with kill and recommend-only EXPLAIN suggestions.
Cluster health
A color-coded health board with Slack/Discord alerts and recovery notifications.
Replication
Replica lag, read-only replicas and replication queues, on a live topology map.
Performance
Slowest/most-expensive queries plus a recommend-only tuning and capacity advisor.
Start monitoring — advisor and alerts built in
Open the hosted dashboard and connect a cluster, or self-host with Docker, Kubernetes, or from source. Self-hosting is always free.