
What to monitor in ClickHouse
ClickHouse monitoring is reading system.query_log, system.parts, system.merges, system.replicas, and related tables — then acting before lag, parts, or runaway queries become an outage. chmonitor ships those views as pages, with a recommend-only advisor that never applies DDL.
Built for this, not bolted on
Queries: running, slow, failed, expensive
system.processes and system.query_log: duration, memory, rows read, the full statement. Kill a runaway from the table. Rank slow and most-expensive queries so tuning starts where it pays off.
Tables, parts, and merges
system.parts and system.merges: table size, part counts, merge backlog, and write amplification. Too many parts or a stuck merge is a storage incident, not a pretty chart.
Replication and cluster topology
system.replicas, replication_queue, and distributed DDL: lag, read-only replicas, in-flight fetches. A live topology map so you see shards, replicas, and Keeper together.
Health checks on one board
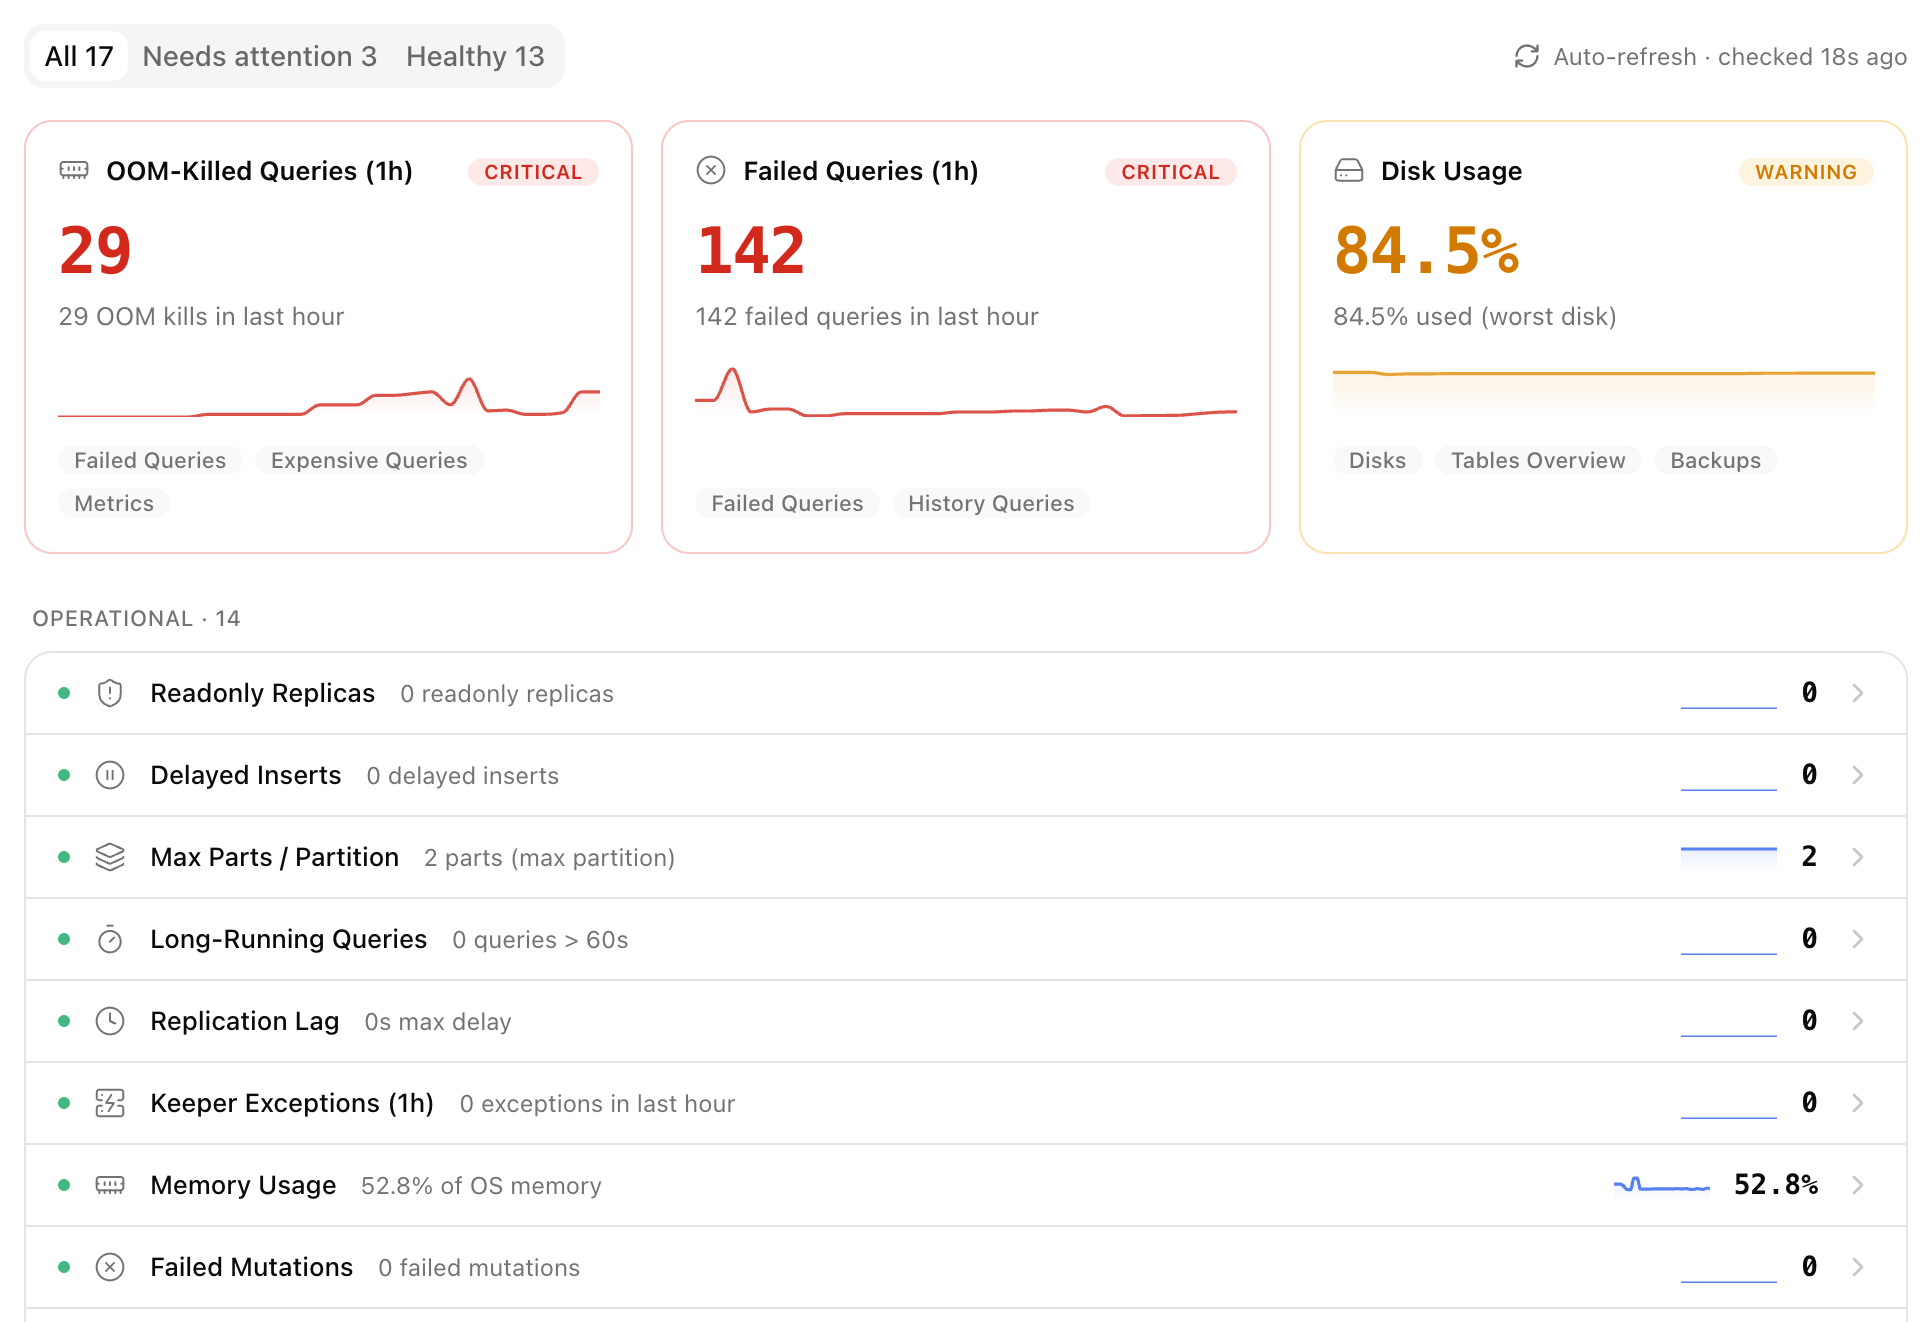
Disk, memory, failed queries, stuck mutations, delayed inserts — color-coded from the same system tables, with Slack or Discord when a check turns red and when it recovers.
Recommend-only advisor
EXPLAIN-based query hints and schema/TTL suggestions you copy and apply yourself. chmonitor never rewrites SQL or runs ALTER/DROP. Grafana and Datadog leave that diagnosis to you.
Questions & answers
What should I monitor in ClickHouse?
Is ClickHouse monitoring the same as a ClickHouse dashboard?
Grafana vs Datadog vs a dedicated ClickHouse monitor?
Does the advisor change my cluster?
Do I need an agent on every ClickHouse node?
Grafana, Datadog, or a ClickHouse-native monitor
Grafana wins as a multi-source canvas. Datadog wins as fleet APM. chmonitor wins when on-call is merges, parts, replicas, and query_log. Honest matrices — including rows we lose — live on the comparison pages.
More comparisons: chmonitor vs Grafana · chmonitor vs Datadog · chmonitor vs ClickHouse Cloud · ClickHouse vs TimescaleDB · ClickHouse vs Postgres · ClickHouse vs Druid vs Pinot
Related
More ways to monitor ClickHouse
Query monitoring
Running, slow, failed and expensive queries — with kill and recommend-only EXPLAIN suggestions.
Cluster health
A color-coded health board with Slack/Discord alerts and recovery notifications.
Replication
Replica lag, read-only replicas and replication queues, on a live topology map.
Performance
Slowest/most-expensive queries plus a recommend-only tuning and capacity advisor.
ClickHouse dashboard
Pre-built ops pages for queries, health, storage and replication — versus building Grafana panels yourself.
Start monitoring — advisor and alerts built in
Open the hosted dashboard and connect a cluster, or self-host with Docker, Kubernetes, or from source. Self-hosting is always free.