chmonitor v0.3.4 — Tools, Schema Compare, workspace roles

The ops dashboard for ClickHouse.

Monitor queries, merges, parts, replication, and health. An AI advisor on top — open source, self-host free.

Watch the v0.3 launch film

  • Real-time queries, merges and replication from system tables
  • Running, slow and expensive query views with EXPLAIN
  • Cluster topology, replica lag and Keeper health
  • Disk, memory and merge backlog on one overview
  • Threshold alerts to Slack, Discord, PagerDuty, Opsgenie, and more
  • AI advisor for schema and tuning — MCP-ready, read-only default

What you get

Everything about your cluster, in one place

Purpose-built views over ClickHouse system tables — queries, replication, storage, and health. No exporters, no extra storage.

AI Agent

Ask your cluster anything

The built-in agent reads schema and query_log before recommending. Connect over MCP from Claude, Cursor or any client.

  • 29 tools across schema, diagnostics and optimization
  • Recommend-only advisor: skip indexes, projections and PREWHERE rewrites
  • Bring your own model, skills and external MCP servers
  • Read-only MCP endpoint — nothing applied without you
  • Learn more →

Query monitoring

Every query, explained

Running, history, failed, slowest and most expensive queries — duration, memory, rows read and the full statement.

  • Queries by user and top patterns over time
  • Saved filter presets and one-click EXPLAIN
  • Kill long-running queries from the table
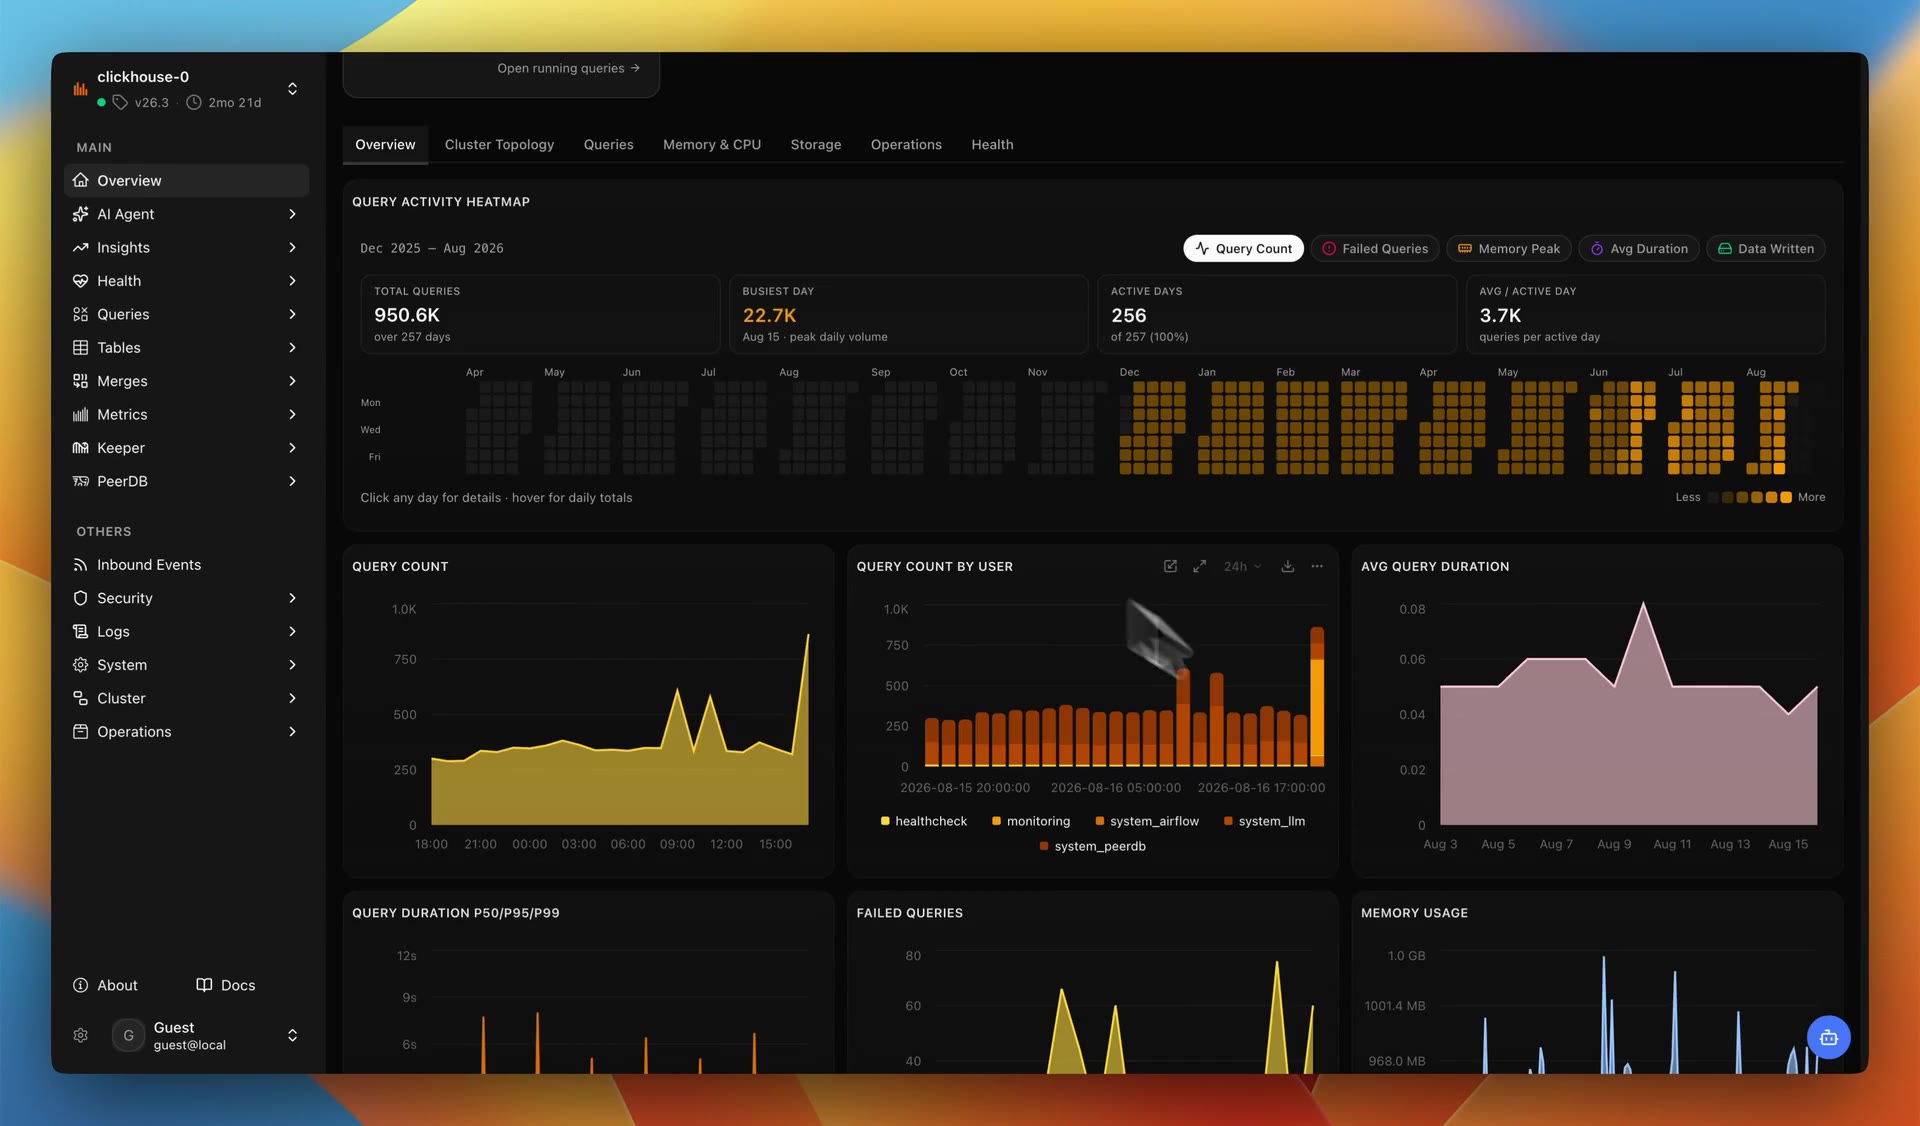
  • Query heatmap and record-breaker insights
  • Learn more →

Cluster topology

See the whole cluster at a glance

Interactive map of nodes, shards, replicas and Keeper quorum — live replication links, health states and per-node metrics.

  • ClickHouse nodes and Keeper quorum with leader and followers
  • Physical and logical clusters, overlapping virtual clusters
  • Per-node CPU, memory and latency — healthy, warn or unreachable
  • Learn more →

Alerting

Know before your users do

Built-in health checks watch replication lag, disk, memory and failed queries — each with tunable warning and critical thresholds.

  • Slack, Discord, PagerDuty, Opsgenie, and more — routed per rule
  • Editable thresholds per check with full fire and recovery history
  • One-click AI audit prompt for any failing check
  • Learn more →

Data Explorer

Explore tables and how they connect

Browse every database and table, map dependencies between them, then drop into SQL — all without leaving the dashboard.

  • Dependency graph: materialized views, dictionaries and sources
  • Run SQL with row counts, timing, DDL and parts inspection
  • Projections, skip indexes and table lineage at a glance
  • Learn more →

Insights

Know your cluster's vitals

Record-breaking queries, storage stats and a full year of activity — surfaced automatically, no dashboards to build.

  • AI-generated findings with stable-key dismissal
  • Query activity heatmap — a year of volume at a glance
  • Storage breakdown by database, table and part
  • SQL console with history, EXPLAIN and scan analysis
  • Learn more →

PeerDB replication

Watch your Postgres → ClickHouse CDC

Point chmonitor at your PeerDB API and every mirror gets live status, rows-synced trends, lag triage and slot health — read-only, proxied, no agent.

  • Fleet view: running / snapshotting / paused / failed at a glance
  • Per-mirror detail: batch history, partition sync progress, peer info
  • Worst-lag triage strip and replication-slot health across peers
  • Aggregated logs and alerts, filterable by severity
  • Learn more →

Postgres · Beta

Monitor Postgres alongside ClickHouse

Same dashboard, same read-only guarantees. Query insights from pg_stat_statements, live activity from pg_stat_activity, and agent tools — free on every plan while in beta.

  • Slowest query patterns from pg_stat_statements
  • Live pg_stat_activity, refreshed every 5 seconds
  • Every query pinned read-only, SSRF-guarded connections
  • Four env-gated AI agent tools for Postgres
  • Learn more →

Full coverage

One dashboard for the whole cluster

From a high-level overview down to ZooKeeper logs and replication mirrors, every system table you reach for, already laid out.

Overview & health

CPU, memory, connections and replication status at a glance, with cluster-wide health checks.

Query monitoring

Running, slow, failed and most-expensive queries with full query detail and kill actions.

Cluster insights

Record-breaking scans, busiest days and totals, surfaced automatically from query history.

Traffic & ingestion

Insert throughput, compression ratios, write amplification and disk write speed over time.

Storage & tables

Table sizes, compression and disk headroom, down to part-size distribution.

Merges & parts

A live part-lifecycle timeline with merges, mutations and moves by table.

Cluster topology

Nodes, shards, replicas and Keeper drawn as a live topology map.

PeerDB replication

Mirrors and peers with live status, rows-synced trend, CDC batches and slot health.

Advisor

Recommend-only tuning: skip indexes, projections, PREWHERE and TTL advice, ranked by impact.

Alerting

Health checks with editable thresholds; Slack, Discord, PagerDuty, Opsgenie, and more; full alert history.

Security & access

Users, roles, grants and quotas, review who can touch what from one place.

Logs & system

Query, error, trace and ZooKeeper logs plus settings and metrics, searchable and time-ranged.

Why chmonitor

Purpose-built for ClickHouse

General-purpose tools treat ClickHouse as one data source among many. chmonitor reads its system tables directly and tracks nothing else. Here's how it stacks up against the most common alternatives.

chmonitorGrafana + CH pluginDatadogCH native /dashboard
Setup time~5 min (Docker or CF Workers)Grafana + datasource plugin installAgent on each ClickHouse nodeEnable in ClickHouse config, restart
No exporters / agents needed reads system tables directly optional CH datasource plugin agent required on each node built into CH
ClickHouse-specific depthPurpose-built: merges, parts, replication, query log, system healthGeneric SQL panels, you write the queriesGeneric agent metrics; limited CH specificsBasic built-in panel; minimal detail
AI agent + MCP built-in AI agent; MCP server at /api/mcp none AI Advisor on paid plans none
Traffic & ingestion insights insert performance, compression, write amplification, disk write speed possible, you build every panel generic throughput metrics only none
CDC & Postgres monitoring PeerDB mirrors, snapshot & slot health; Postgres source (beta) separate datasources, manual dashboards Postgres integration, no PeerDB none
Alert rules & channels Built-in health checks, editable thresholds; Slack, Discord, PagerDuty, Opsgenie, and more + per-rule routing and full alert history Grafana Alerting: many channels and routing rules, once you've built the CH panels Datadog Monitors: broad integrations, mature escalation policies none
Version-aware queries SQL adapts to CH schema by version you manage query compatibilityN/A fixed to bundled version
CostFree self-host; cloud in early accessGrafana OSS free; Grafana Cloud paid~$15–23 per host per month (varies)Free (bundled with ClickHouse)
Open source / self-host GPL-3.0; Docker, CF Workers, K8s Helm Grafana OSS (AGPL-3.0) SaaS only within ClickHouse
Costs and features for third-party tools reflect publicly available information and may change. Always verify before purchasing.

Want the deep dive? chmonitor vs Grafana · vs Datadog · vs ClickHouse Cloud

FAQ

Questions & answers

Answers to what evaluators ask most before deploying chmonitor.

How do I deploy chmonitor?
The fastest path is Docker: docker run -d -p 3000:3000 -e CLICKHOUSE_HOST=... ghcr.io/chmonitor/chmonitor:latest. It also deploys to Cloudflare Workers and Kubernetes via the bundled Helm chart. See the quickstart for step-by-step instructions.
Does it need exporters or agents installed on ClickHouse?
No. chmonitor reads ClickHouse system tables directly over the standard HTTP interface. There is no sidecar to run, no exporter to configure, and no extra storage to provision.
Is it safe to connect my production cluster?
Yes, when you use a read-only ClickHouse user. chmonitor only issues SELECT queries against system tables and never writes to your data. The AI agent is also read-only. You control what the connection user can access.
What is the performance impact on ClickHouse?
Low. All queries target system tables with a configurable execution timeout (default 60 s). Dashboard pages cache responses via TanStack Query so repeated views do not re-query the cluster.
What license is chmonitor under?
chmonitor is open source under the GPL-3.0 license. You are free to use, modify and redistribute it under those terms.
What is the difference between self-host and cloud?
Self-hosting gives you full control — GPL-3.0, no license key, run it next to ClickHouse. Optional commercial licenses are yearly or lifetime, sized by host count, for invoices and support. The hosted cloud at dash.chmonitor.dev is only if you do not want to operate the dashboard yourself.
Which ClickHouse versions are supported?
chmonitor uses version-aware SQL, queries adapt to the system table schema of the connected ClickHouse version. It is regularly tested against recent stable releases.

More questions? Ask on GitHub Discussions.

Start monitoring — advisor and alerts built in

Open the hosted dashboard and connect a cluster, or self-host with Docker, Kubernetes, or from source. Self-hosting is always free.